Records are the source of truth
Every video has a manifest with data sources, composition, render version and upload URL. The list on this page was generated from those records.
Chart races, 3D terrain flights, a Blender 3D world map, pitch heatmaps. For each topic I design how the data should be seen, starting from the format itself, to make videos you will not find on other channels. Data comes from more than 20 kinds of sources, from sports records and economic indicators to opinion polls, streaming charts and terrain elevation, and the repeatable work (collection, aggregation, rendering) runs on a pipeline built with AI agents (Claude Code). The same templates also power English-language channels as the work expands overseas. One frame from one video per type is shown here. Click a frame to open that video on YouTube.
Each type started with a new format. Once built, a template is reused with its query skeleton, so a new topic only changes the data.
Decades of cumulative records pulled from the database, replayed as rankings change. Side panels such as "compared at the same age" come from the same template.
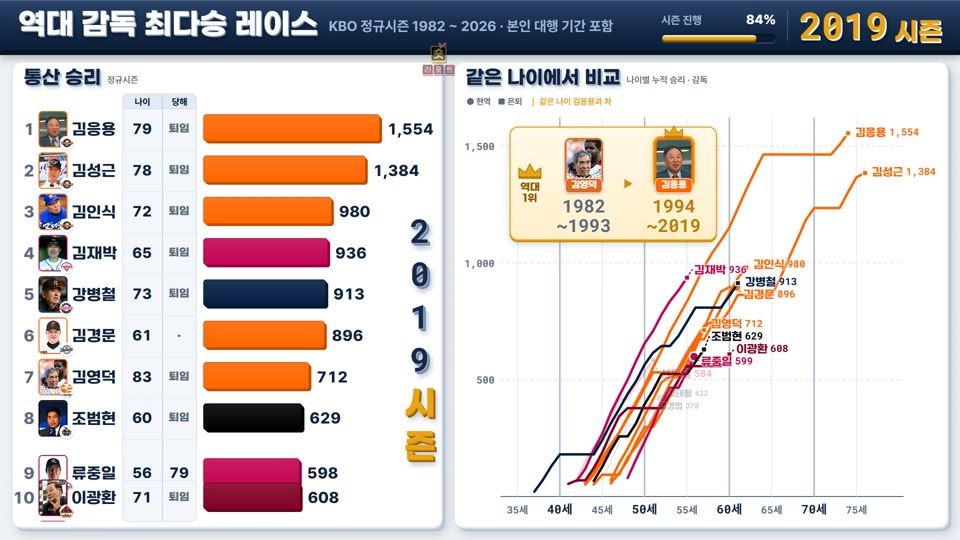 Long-form · 2m 09sKBO managers, career wins race 1982-2026Only three managers have reached 1,000 wins숏리포트 · 2026-10-21
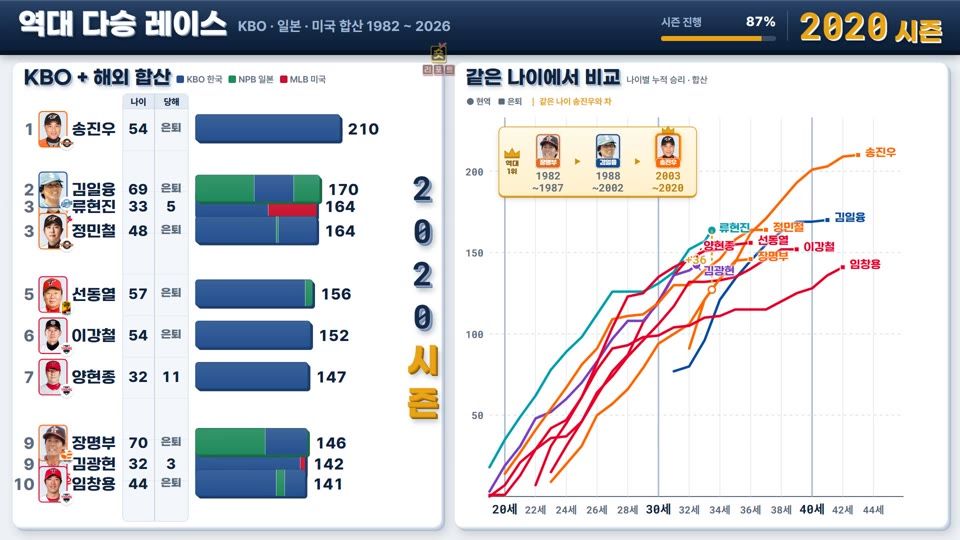 Long-form · 3m 26sAll-time pitching wins race, KBO + Japan + US combinedSong Jin-woo 210, Ryu Hyun-jin 204 and counting숏리포트 · 2026-10-18
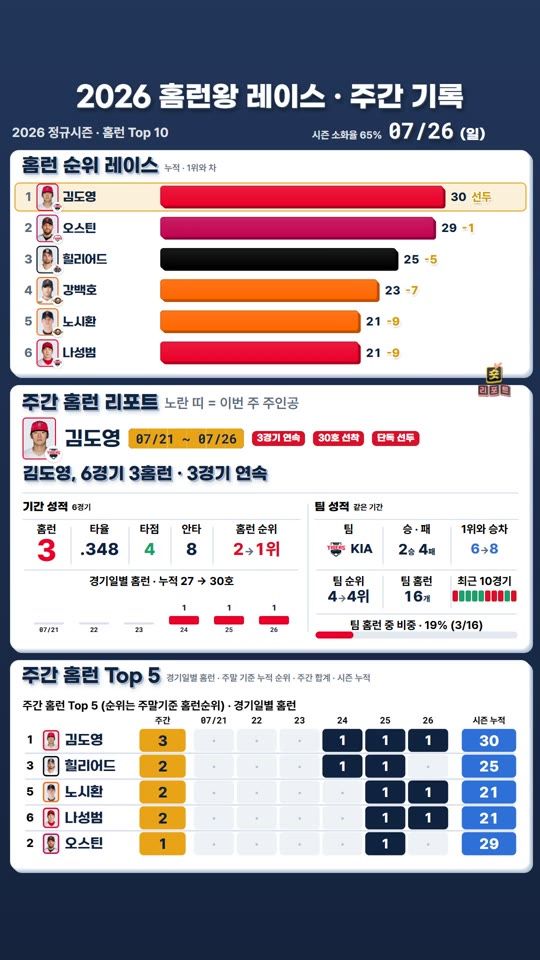
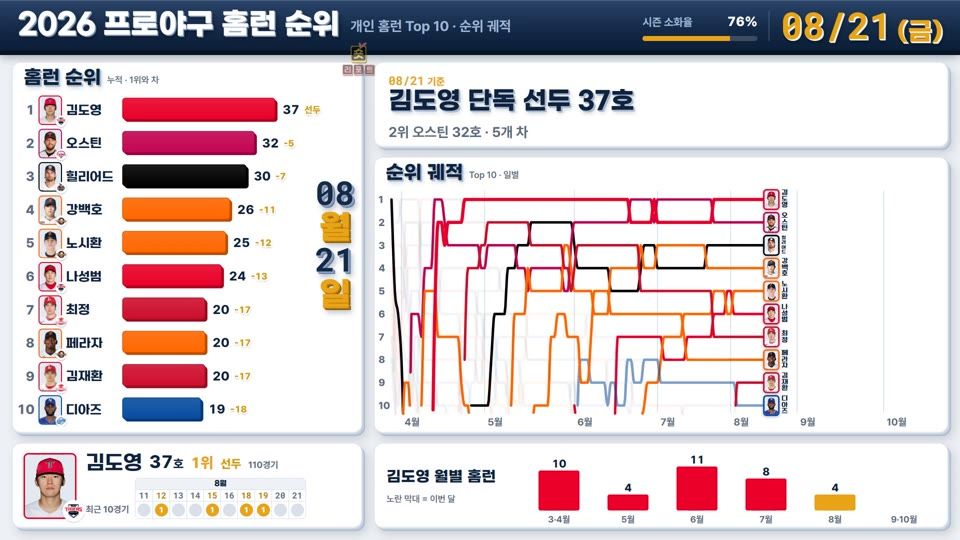 Long-form · 2m 19s2026 KBO home run race, Top 10 by dayThe title was decided on the final day숏리포트 · 2026-10-15
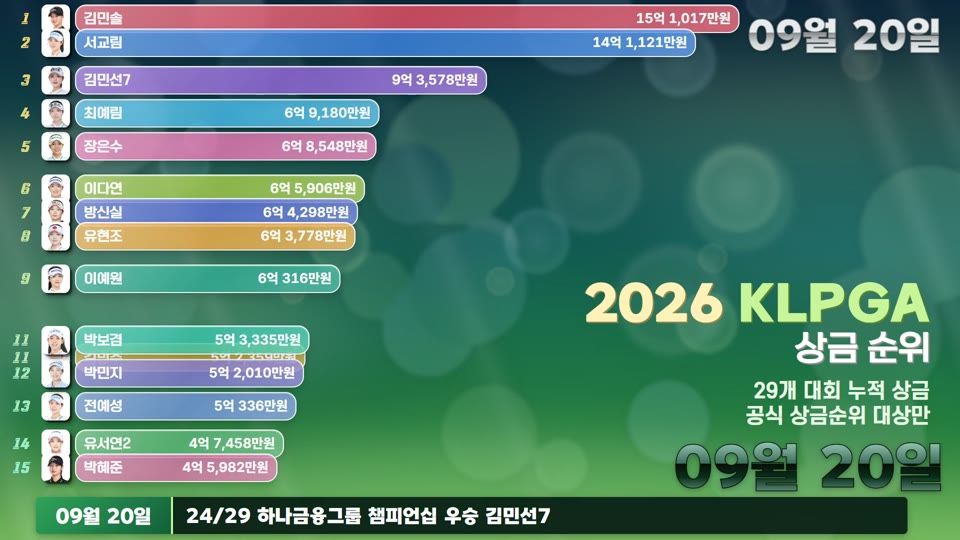 Long-form · 2m 14s2026 KLPGA prize money race29 events, two players within 200 million won숏리포트 · 2026-11-09
Blender driven from Python (bpy): the scene is generated from data and the animation baked. Item count, bar heights and camera paths are computed from the data, and renders go out as resumable PNG sequences. One builder produced shorts for all 12 World Cup groups at once.
 Long-form · 8m 46s2026 World Cup: market value of all 48 squads on a 3D world mapFlying across the map, one squad value at a time숏리포트 · 2026-06-02
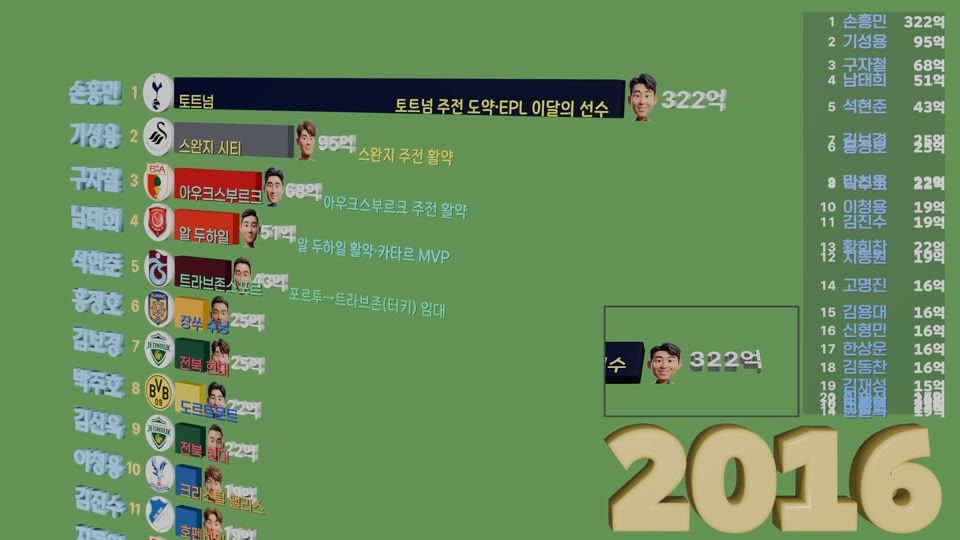 Long-form · 4m 15sKorean footballers, market value Top 20 (2004-2026)From Park Ji-sung to Son Heung-min, as a 3D bar race숏리포트 · 2026-06-08
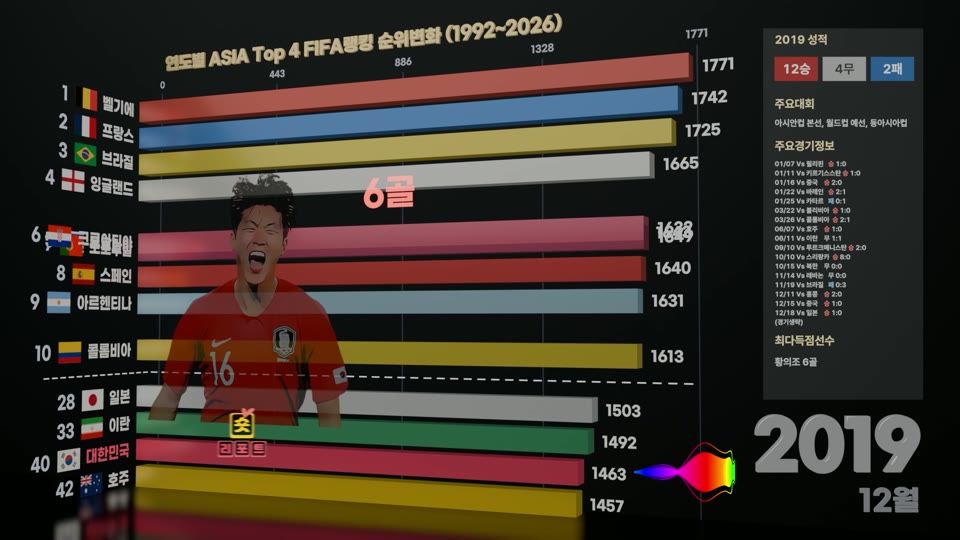 Long-form · 4m 39sFIFA ranking race 1992-2026Korea, Japan, Iran and Australia against the world Top 10숏리포트 · 2026-05-26
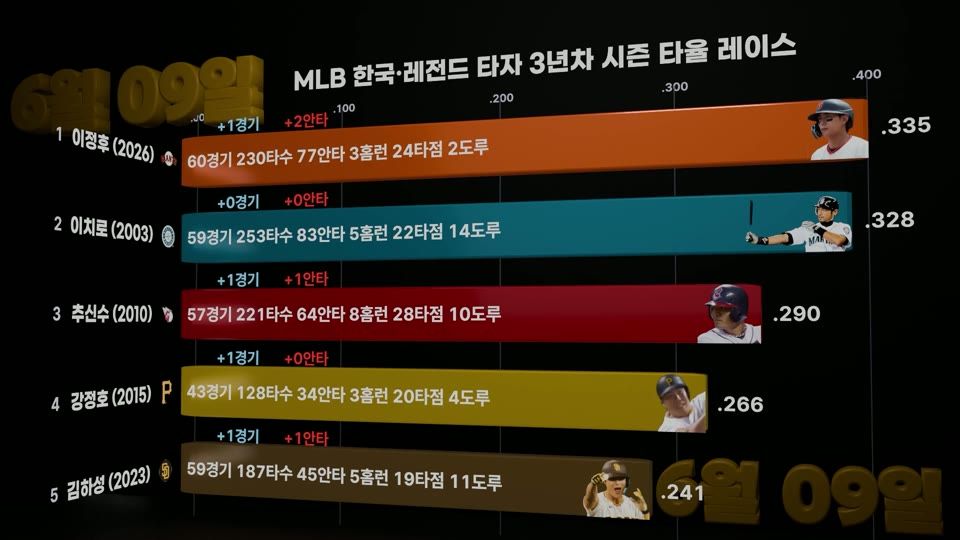 Long-form · 4m 17sCan Lee Jung-hoo catch Ichiro? Third-season batting raceKorean big leaguers and legends compared date by date숏리포트 · 2026-06-18
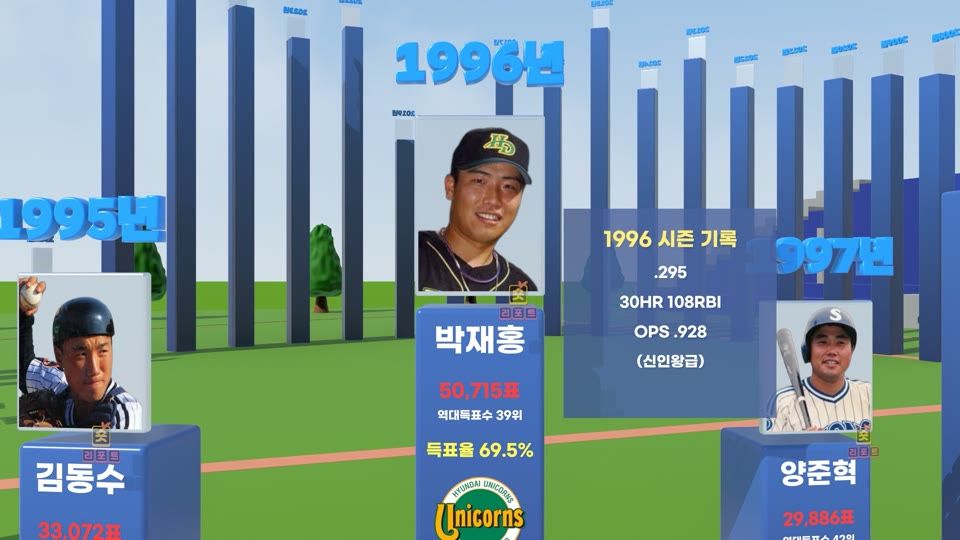 Long-form · 3m 43sKBO All-Star top vote-getter by year (1982-2026)The most popular player of each era, standing in a 3D ballpark숏리포트 · 2026-07-01
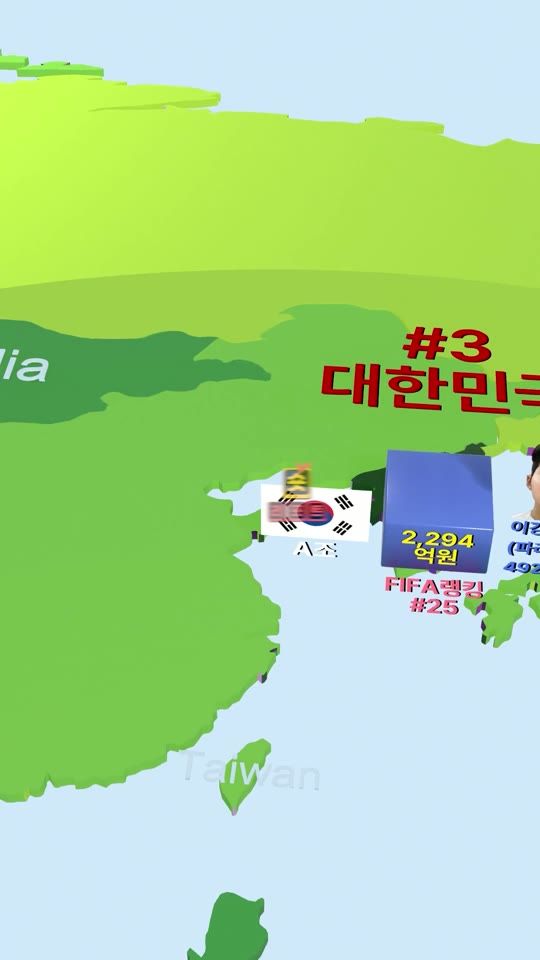 Short · 37sWorld Cup Group A squad values (one of 12 group shorts)Korea vs Mexico vs Czechia vs South Africa숏리포트 · 2026-06-14
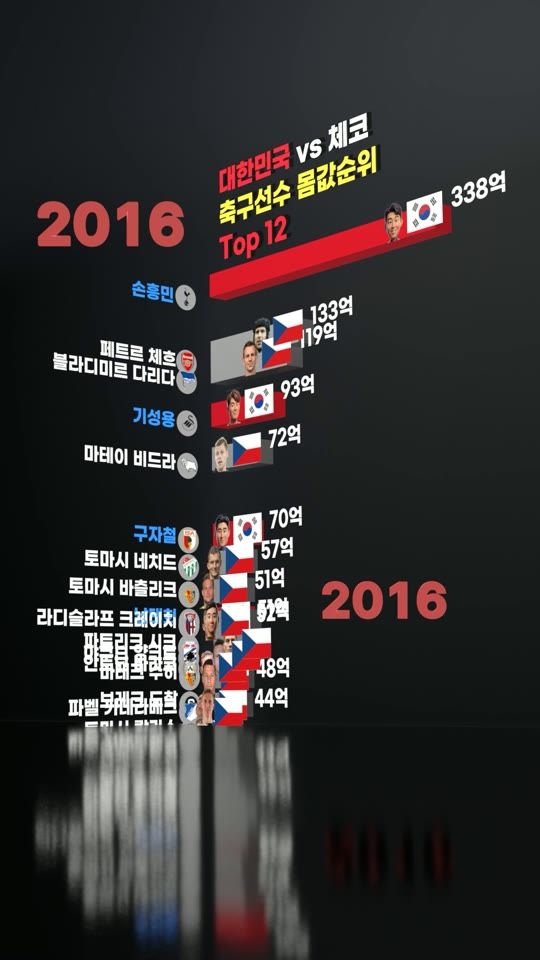 Short · 1m 29sKorea vs Czechia player market values (2004-2026)Both squads in a single race숏리포트 · 2026-06-11
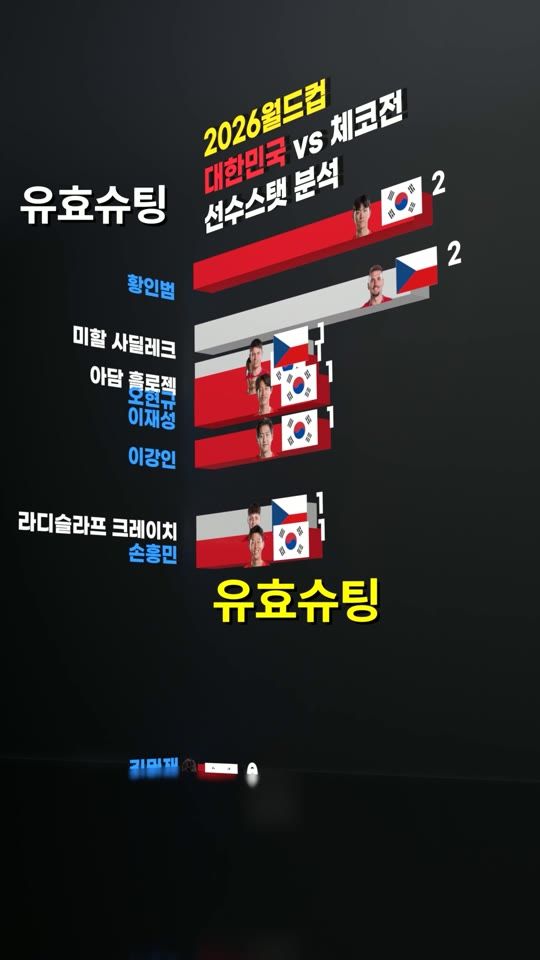 Short · 57sWho was the real MVP against Czechia? 18 statsThe ranking is rebuilt for every stat숏리포트 · 2026-06-12
Real satellite imagery and elevation data are downloaded along the route and baked into 3D terrain (about 9 GB for the Jeju flight). A helicopter or an F-15K then flies low along real roads or a hand-picked route. The F-15K model was repainted and its rig baked in Blender; speed, altitude, place names and the minimap are computed for every frame.
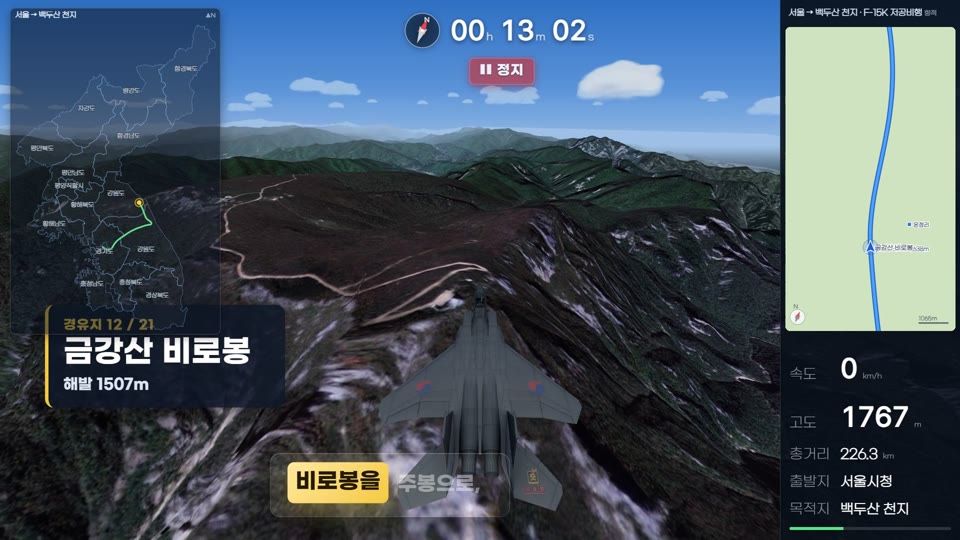 Long-form · 8m 35sSeoul to Mount Baekdu: a 650 km low-level F-15K flightPast Seoraksan and Geumgangsan to the crater lake숏리포트 · 2026-07-29
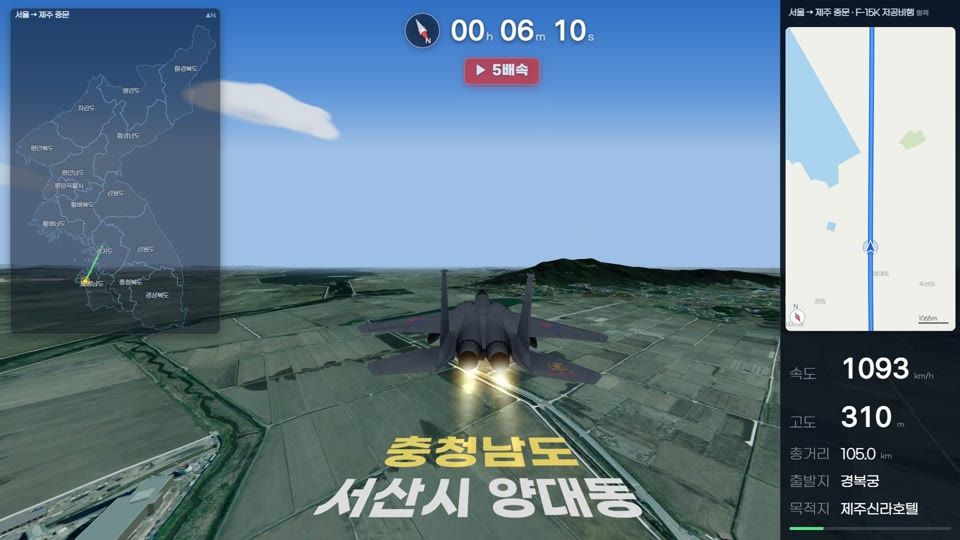 Clip · 25sSeoul to Jungmun, Jeju: a non-stop F-15K flight586 km via Taean, Jeonju, Seonyudo and MokpoNot on YouTube · full video 6m 11s · 2026-07-29
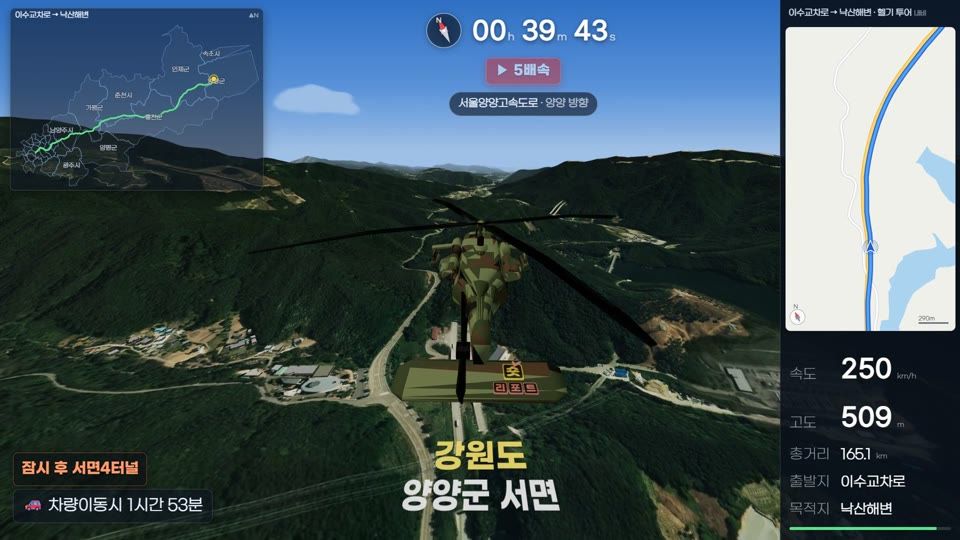 Long-form · 9m 15sHelicopter tour EP02: Seoul to Naksan Beach, Yangyang, 181 kmFollowing the actual driving route, road by road숏리포트 · 2026-07-27
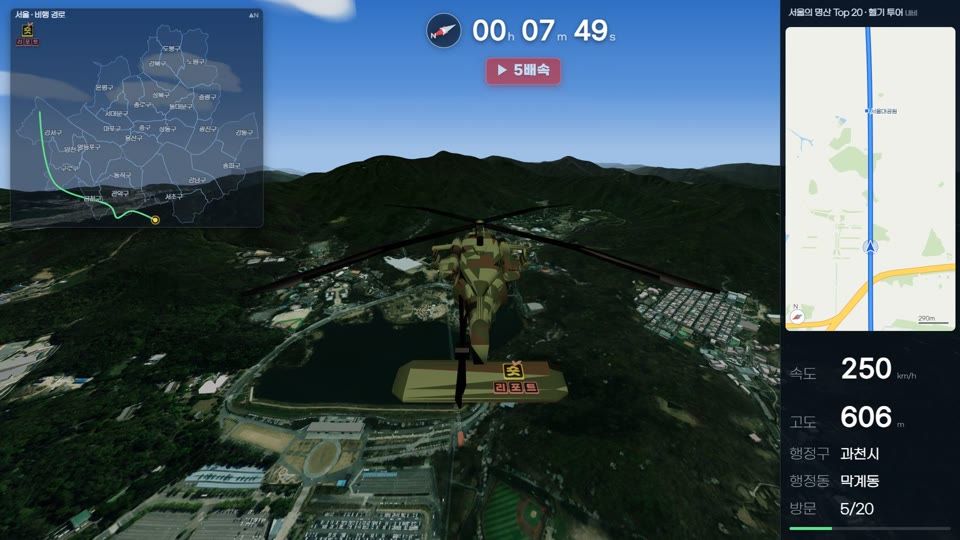 Long-form · 10m 09sHelicopter tour EP01: 20 mountains of SeoulVisiting all 20 in order of height숏리포트 · 2026-07-23
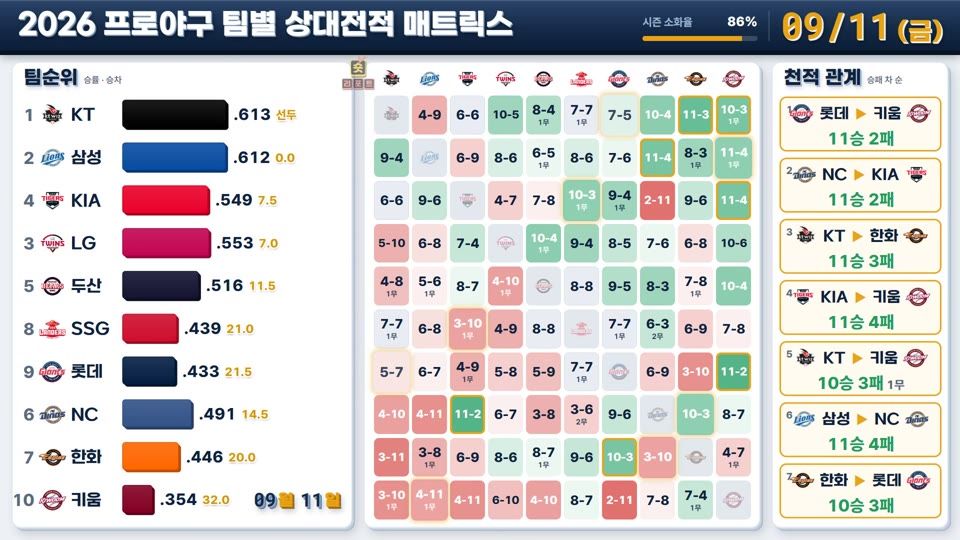
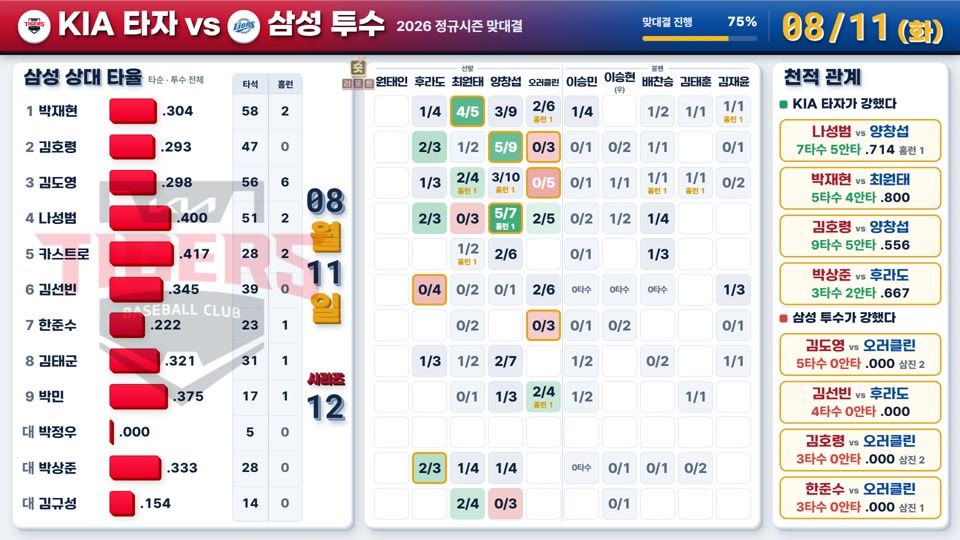
Team and player matchups re-aggregated by date into a matrix with "nemesis" pairs. Updated daily during the season.
After the final whistle the pipeline collects the box score, shot and batted-ball locations and scoring by inning or quarter, then builds a long-form video and a short the same day. Baseball, football and basketball share one skeleton.
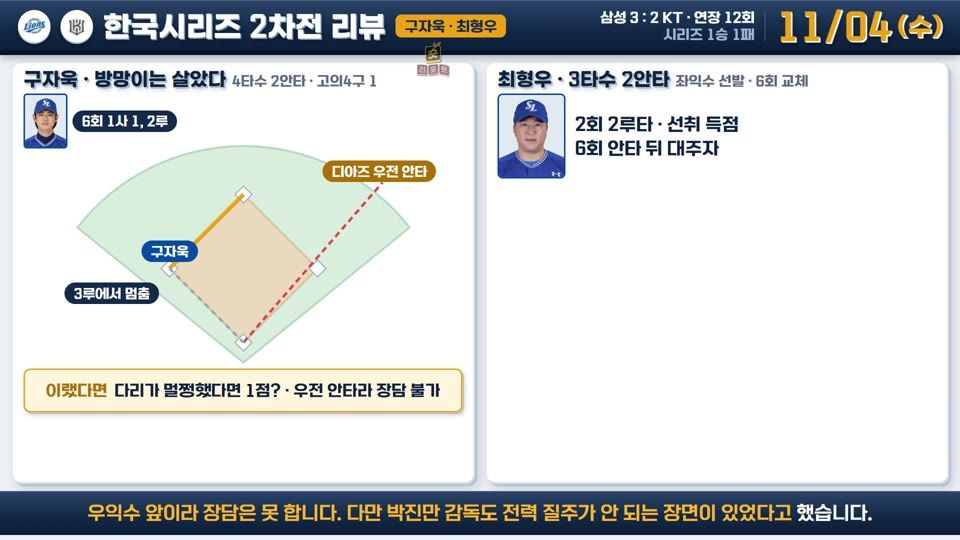 Long-form · 4m 39sKorean Series Game 2 review, Samsung 3-2 KT (12 innings)25 hits produced 5 runs; an error in the 12th decided it숏리포트 · 2026-11-05
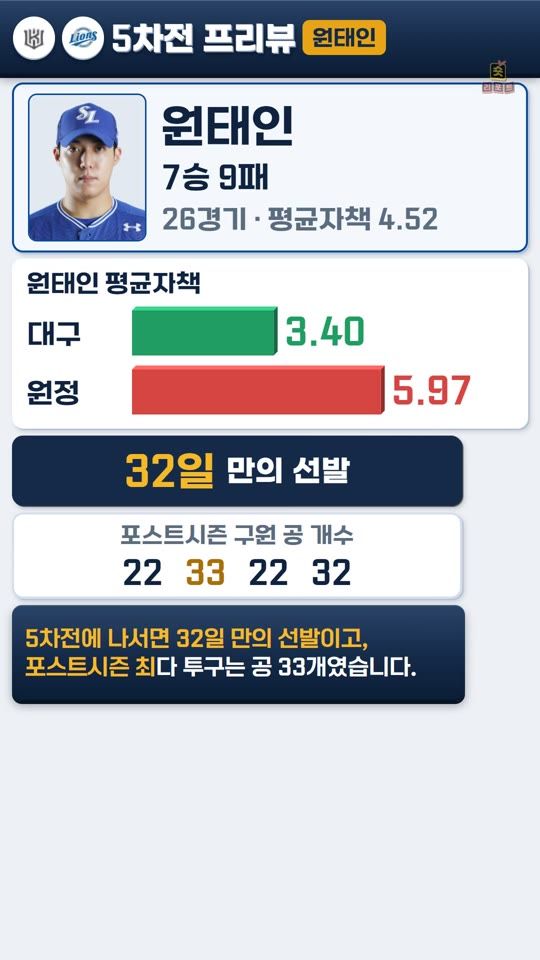 Short · 1m 15sKorean Series Game 5 preview (short)A first title in 12 years, or back to Suwon숏리포트 · 2026-11-07
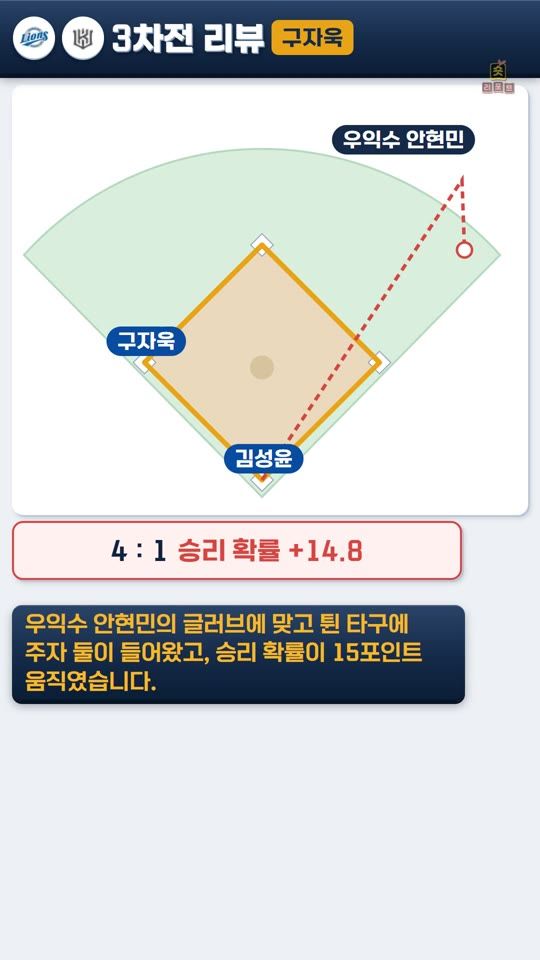 Short · 1m 17sKorean Series Game 3 review (short)Five runs on four hits; five walks by the 2nd inning decided it숏리포트 · 2026-11-07
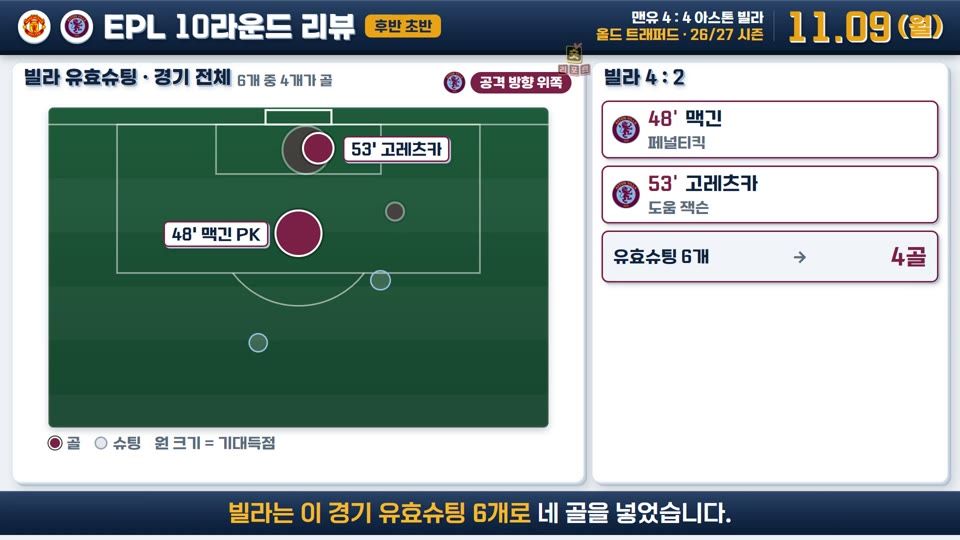 Long-form · 2m 44sEPL matchweek 10 review, Man Utd 4-4 Aston VillaAn equaliser in the 96th minute after coming back from two down, twice숏리포트 · 2026-11-10
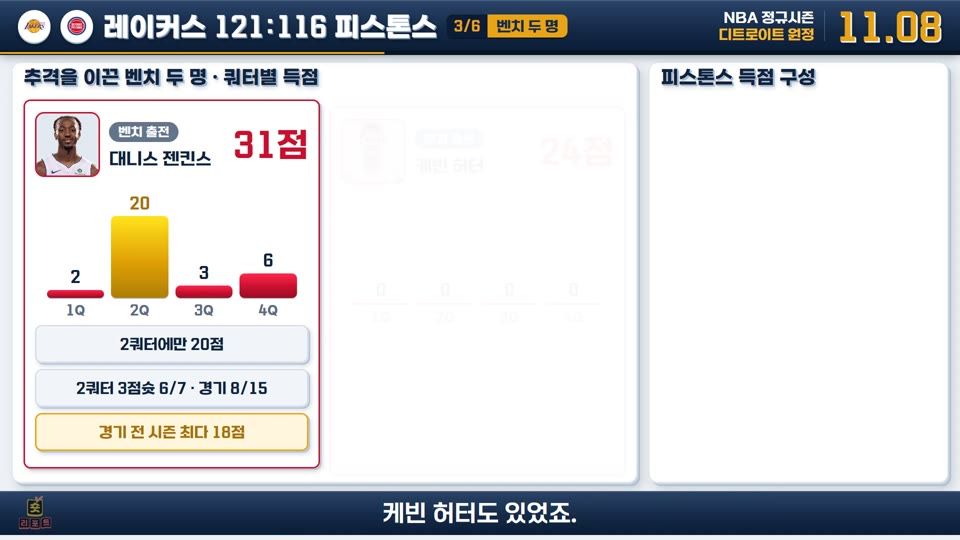 Long-form · 2m 54sNBA review, Lakers 121-116 PistonsA 26-point lead shrank to one; Reaves held on with 43숏리포트 · 2026-11-10
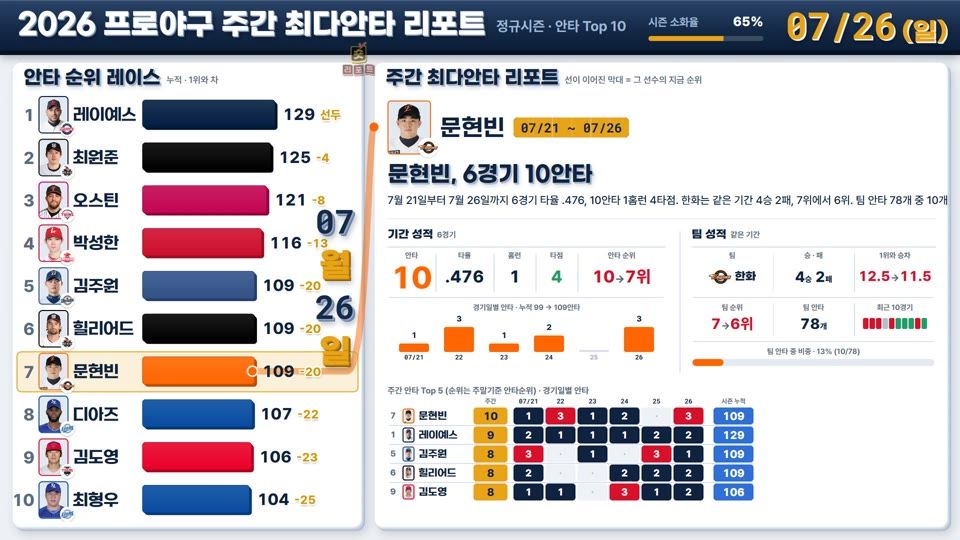
A whole season sliced into weeks: each week's Top 5 and its standout player, stitched into one event timeline.
Player location data drawn on real pitch and court coordinates. Football heatmaps, basketball shot charts and baseball batted-ball maps come from the same engine.
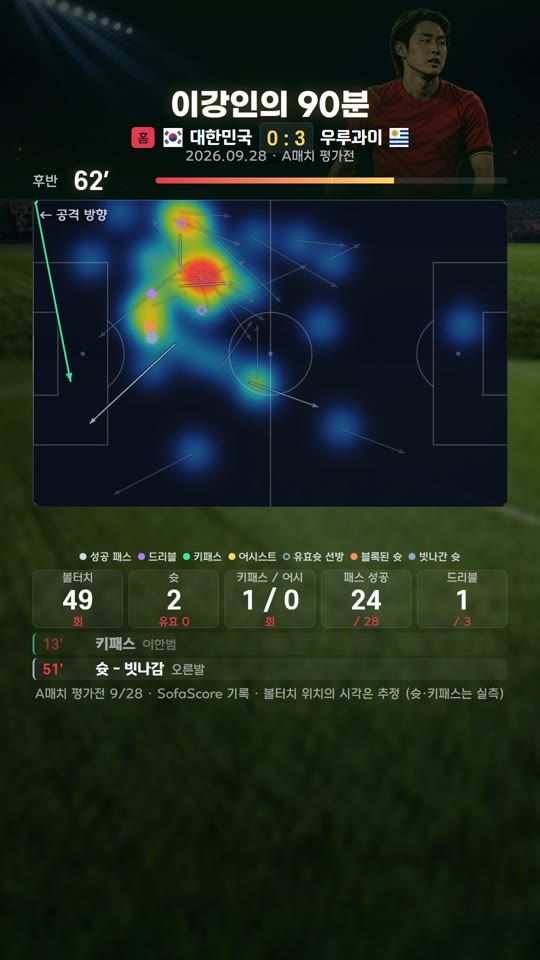 Short · 34sLee Kang-in heatmap, Korea 1-4 UruguayThree key passes, joint most of all 32 players숏리포트 · 2026-10-01
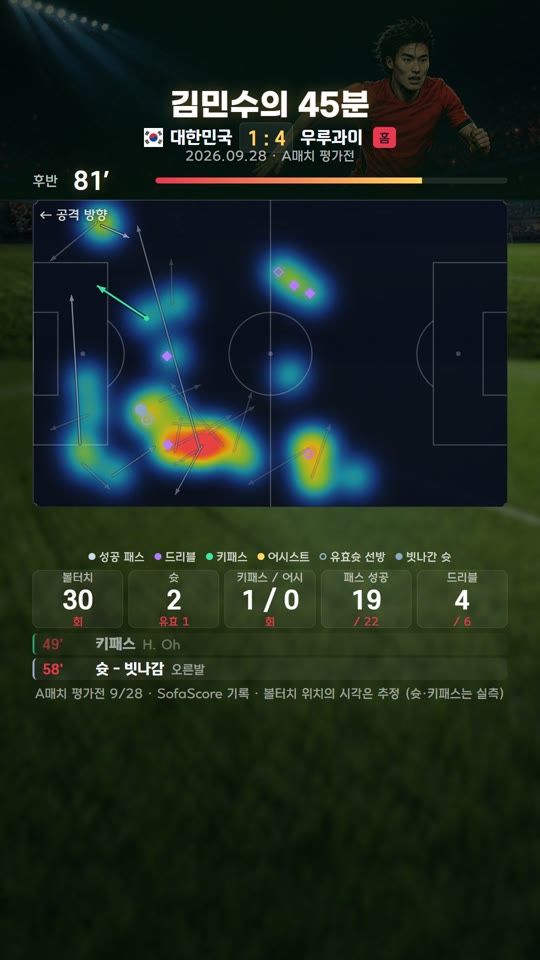 Short · 20sKim Min-su heatmap, international friendlyPlayed only the second half, still joint top for dribbles숏리포트 · 2026-10-01
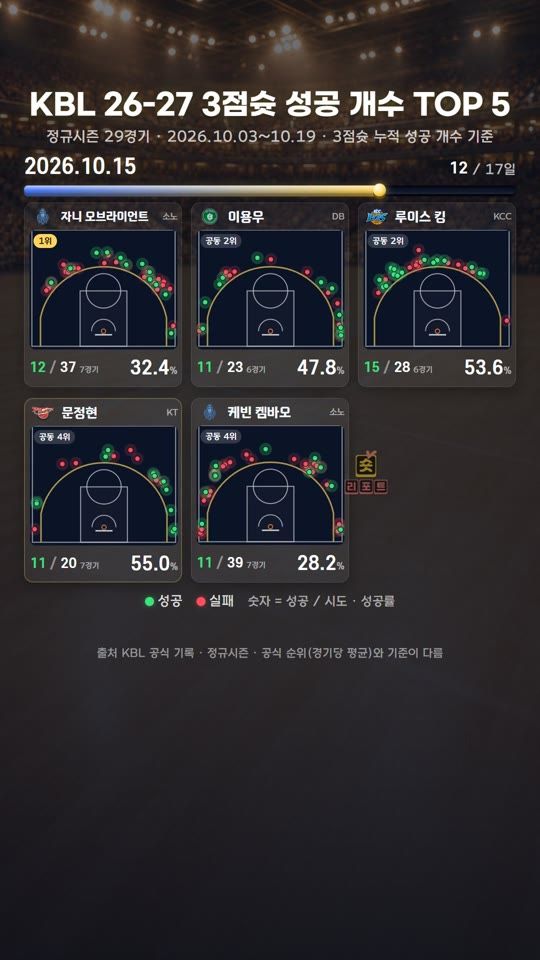 Short · 31sKBL 2026-27 three-point Top 5 shot chartsMoon Jung-hyun at 56.7% from three숏리포트 · 2026-10-20
One ranking table as a 7-second short. A single query against the records tables feeds a card template that sets the title, highlights and colors.
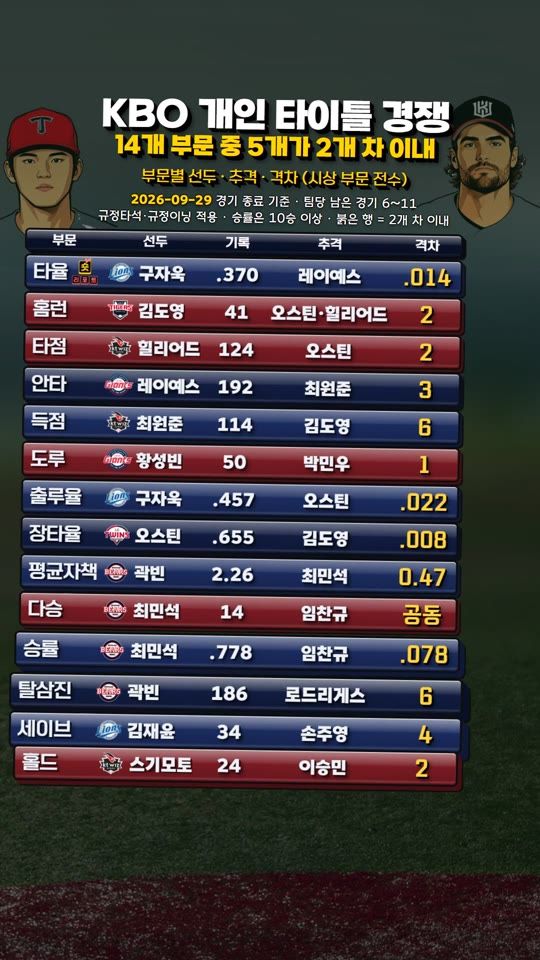 Short · 6sKBO individual title raceKim Do-yeong 41 HR vs Austin and Hilliard 39숏리포트 · 2026-09-30
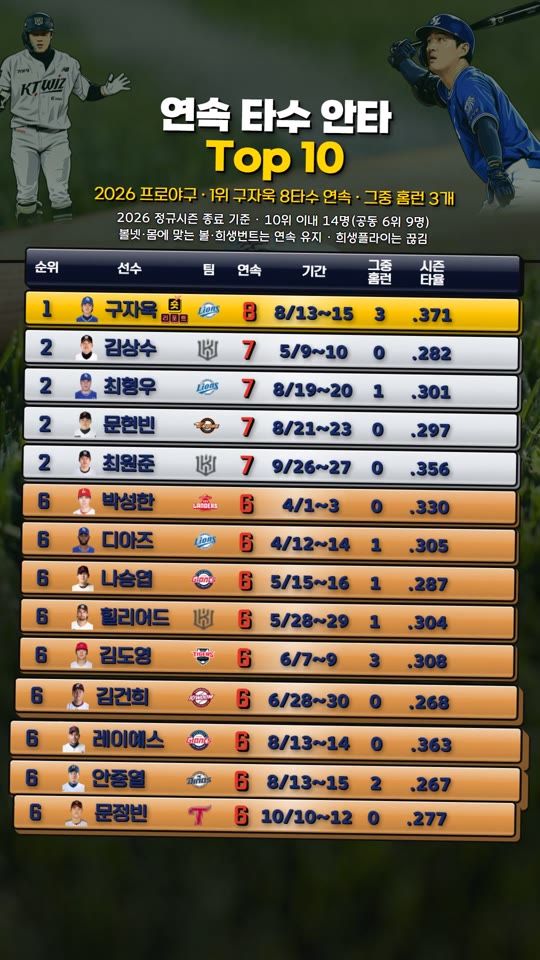 Short · 6s2026 KBO consecutive at-bat hit streaks, Top 10Koo Ja-wook: 8 straight at-bats with a hit, 3 of them homers숏리포트 · 2026-10-23
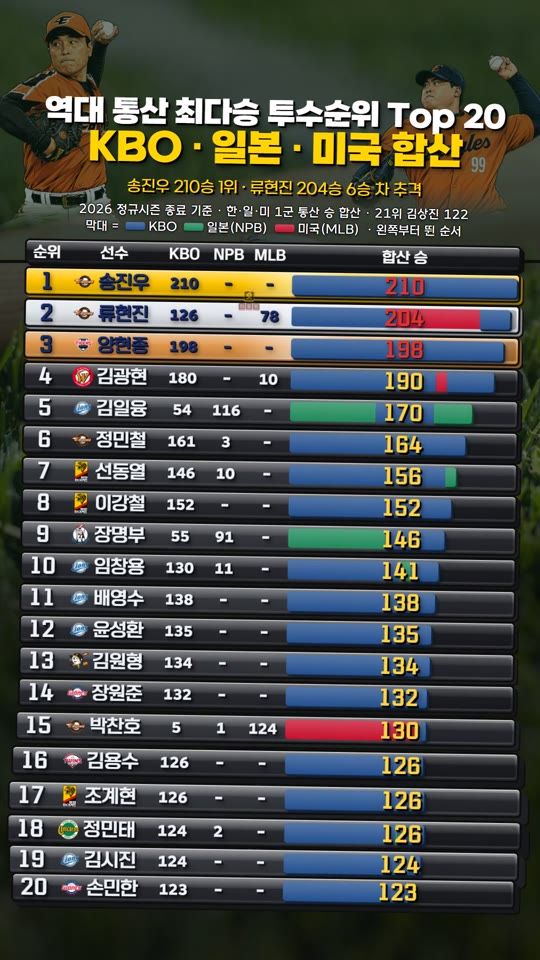 Short · 6sAll-time home runs Top 20, KBO + Japan + USChoi Jeong leads the KBO; add overseas and Lee Seung-yuop has 626숏리포트 · 2026-10-19
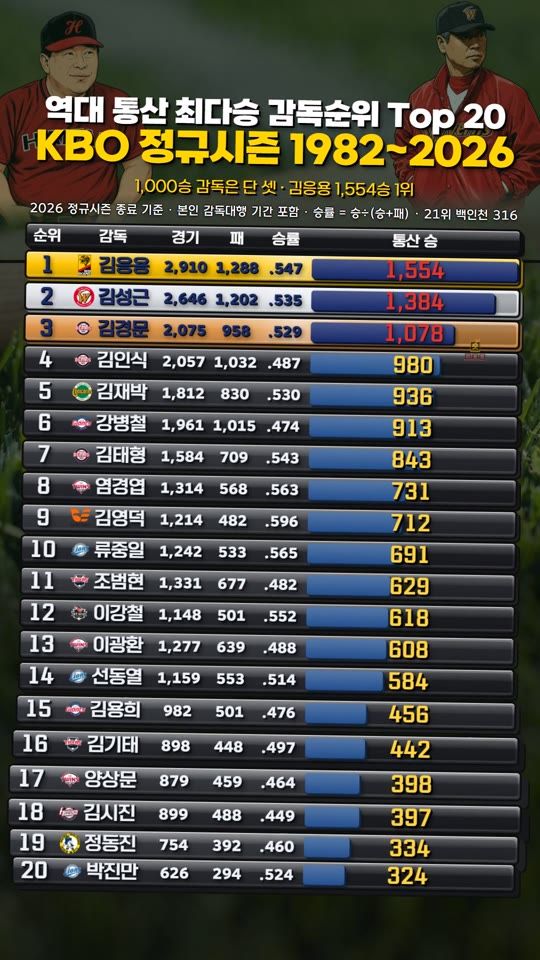 Short · 6sAll-time managerial wins Top 20Kim Kyung-moon, 1,078 wins, most among active managers숏리포트 · 2026-10-21
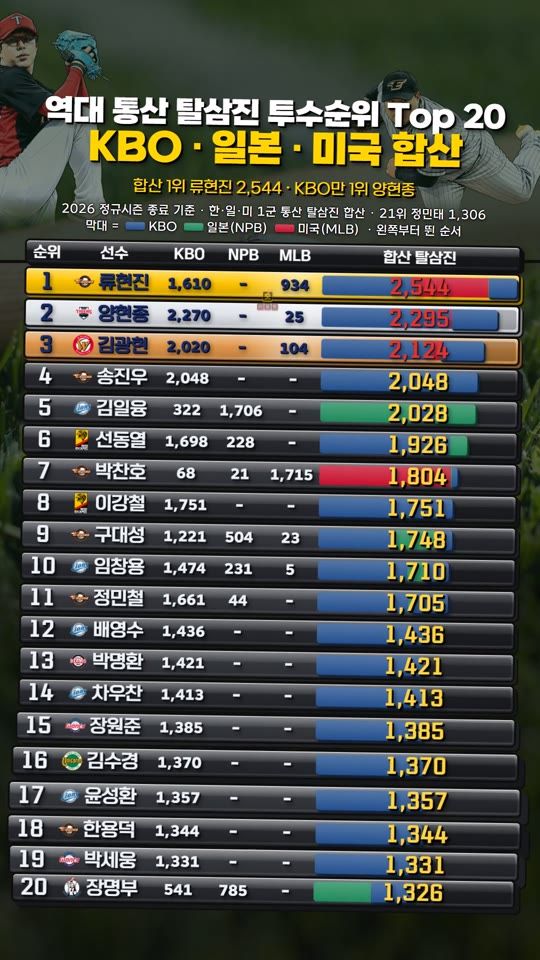 Short · 6sAll-time strikeouts Top 20, KBO + Japan + USRyu Hyun-jin 2,544 first, Yang Hyeon-jong 249 behind숏리포트 · 2026-10-21
The agent scans news and public statistics every day and proposes topics; a person picks, the numbers are verified and the card is built. All sourcing routes are tracked on one dashboard.
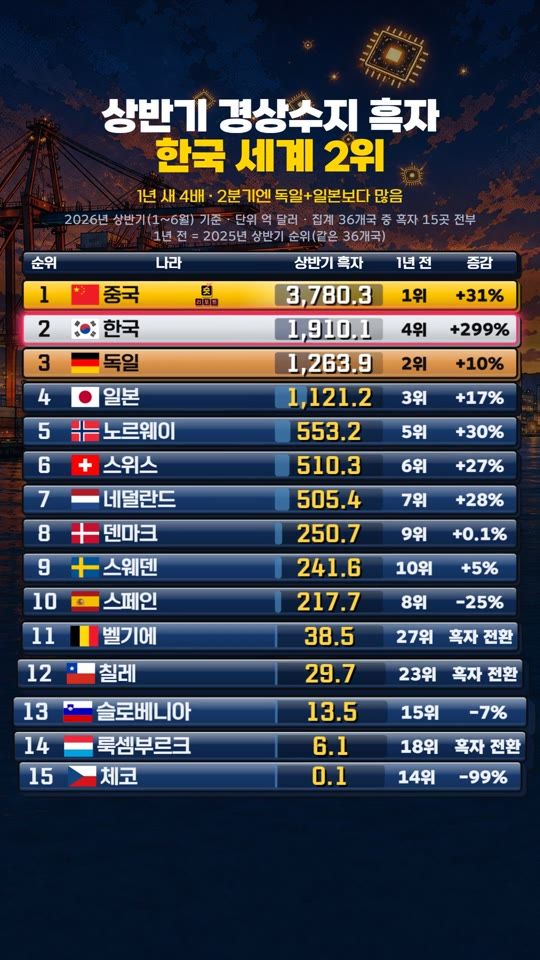 Short · 6sCurrent account surplus ranking, first halfKorea second in the world, ahead of Germany and Japan숏리포트 · 2026-10-26
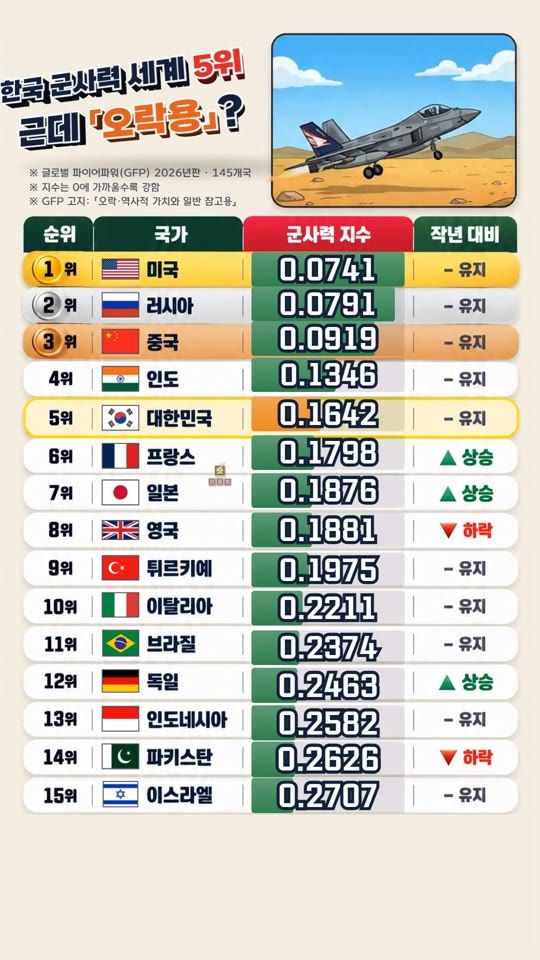 Short · 6s2026 global military strength Top 20Korea 5th, Japan 7th숏리포트 · 2026-10-23
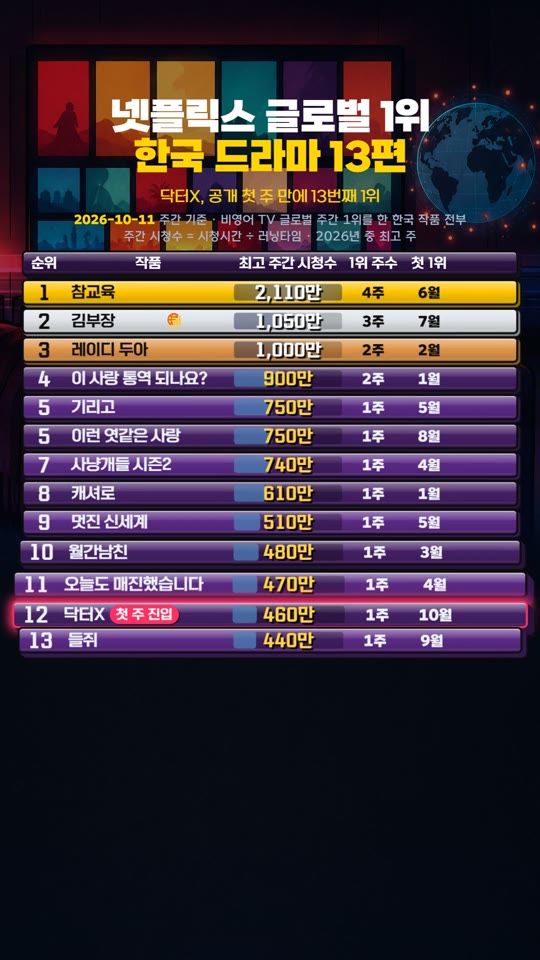 Short · 6s13 K-dramas that topped Netflix worldwide this yearDoctor X hit number one three days after release숏리포트 · 2026-10-15
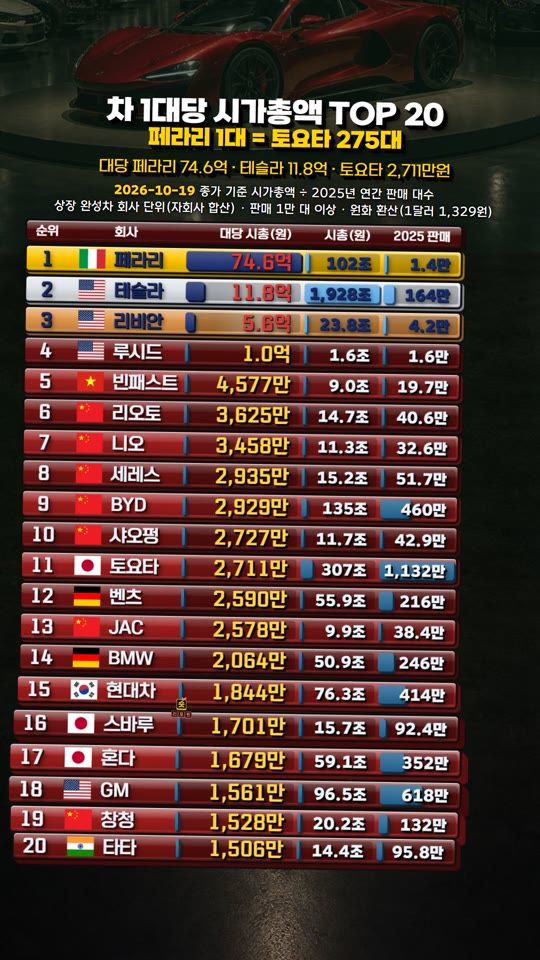 Short · 6sMarket cap per car sold, Top 20Tesla is worth 1.18 billion won per car; Ferrari still leads숏리포트 · 2026-09-29
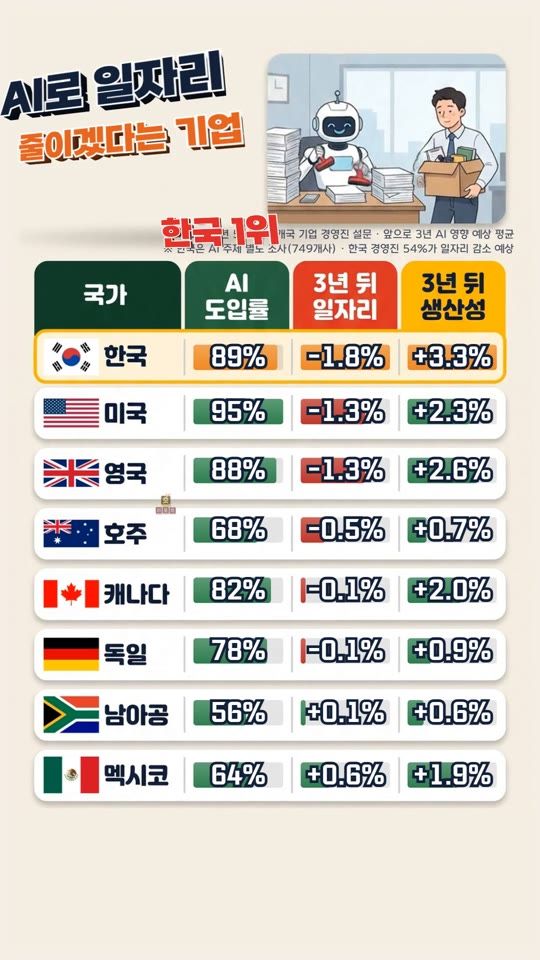 Short · 6sFirms planning AI job cuts, 8-country surveyKorea ranks first숏리포트 · 2026-10-22
VS cards that put two players or two seasons side by side, and a quiz series where one line of stats identifies a player. Both come from the same records database.
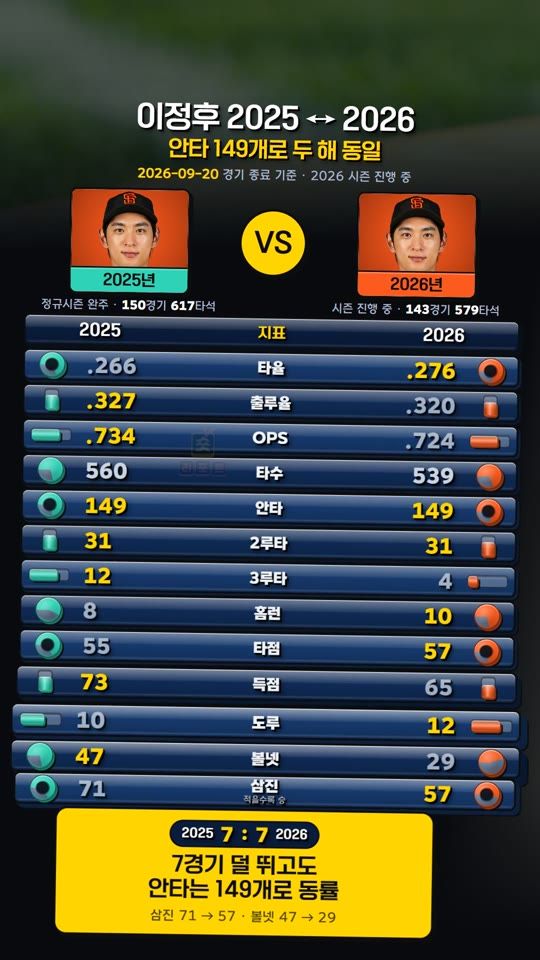 Short · 7sLee Jung-hoo, 2025 vs 2026 seasonSeven fewer games, the same number of hits숏리포트 · 2026-09-21
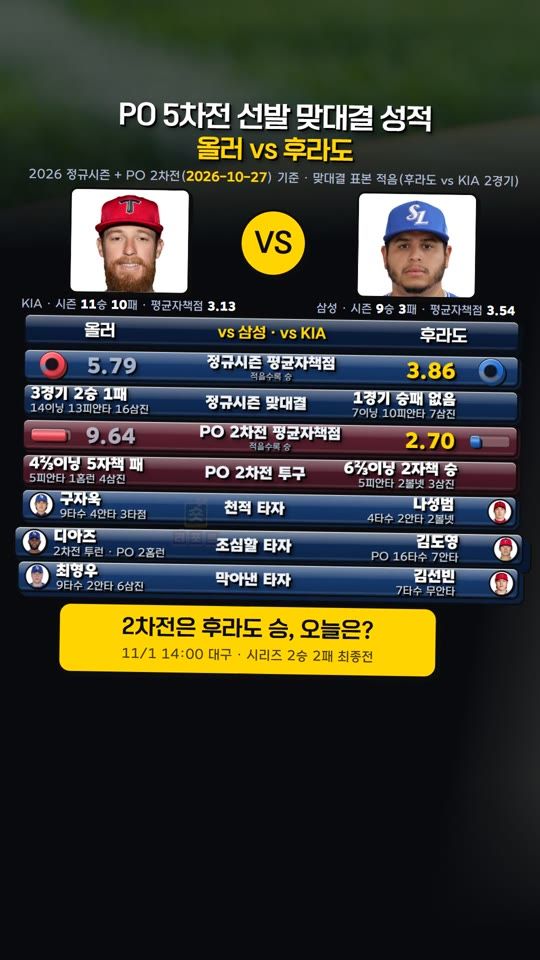 Short · 7sPlayoff Game 5 starters, Oller vs Hurado5.79 ERA vs Samsung against 3.86 vs KIA숏리포트 · 2026-11-01
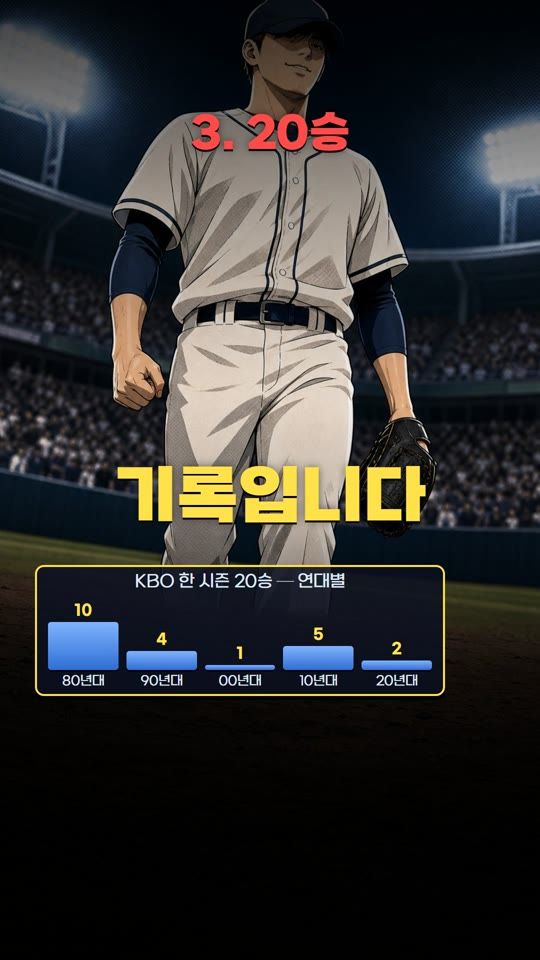 Short · 25s[Quiz] Who set the world record of 21 straight starting wins?A 1990s ace, identified from one line of stats숏리포트 · 2026-09-22
 Short · 31s[Quiz] Released, then came back to win Rookie of the Year. Who?Question 17 in the series숏리포트 · 2026-10-21
The same data and templates with a different language dictionary now run English-language channels (Football Report and Hoops Report). Match reviews ship in Korean and English on the same day.
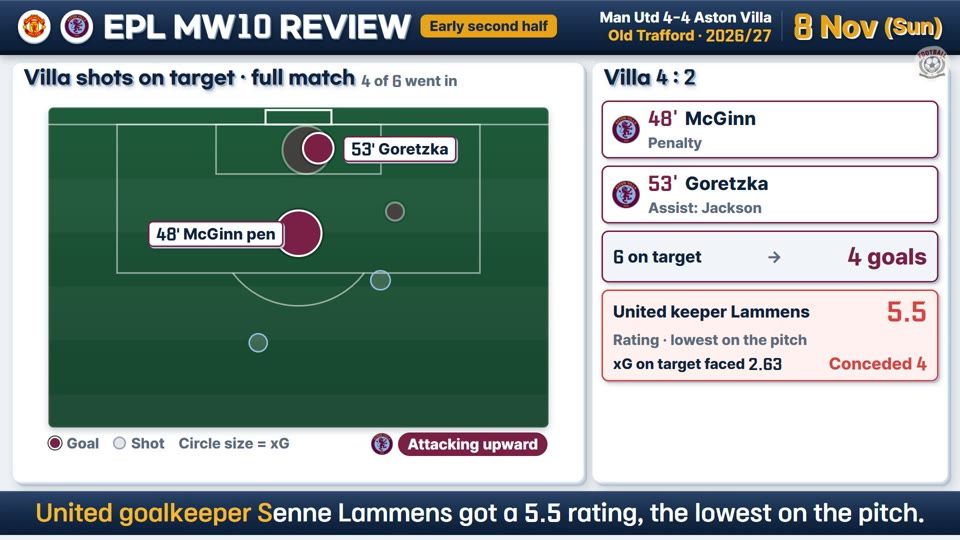 Long-form · 2m 52sEPL matchweek 10 review, Man Utd 4-4 Aston VillaVilla scored four from six shots on targetFootball Report · 2026-11-10
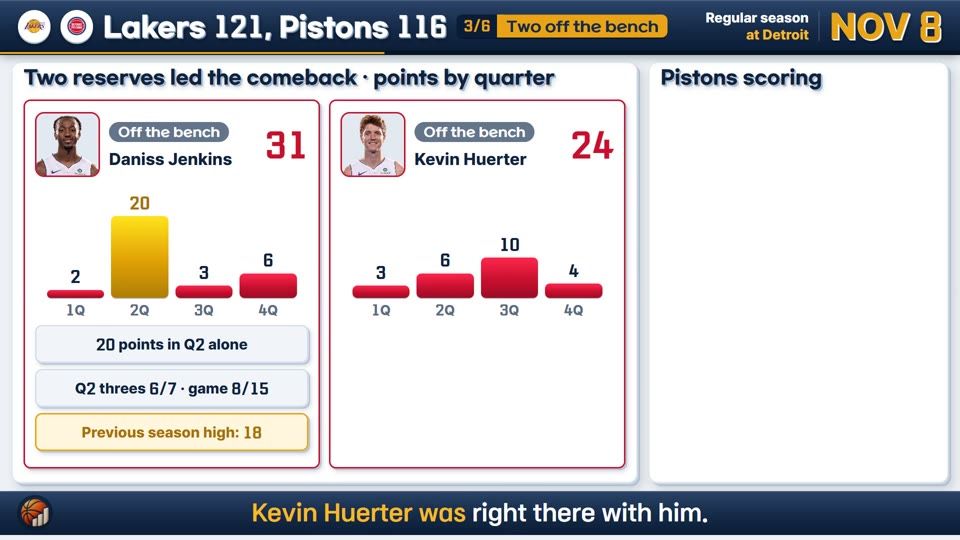 Long-form · 3m 07sNBA review, Lakers 121-116 PistonsTwo reserves led the comebackHoops Report · 2026-11-10
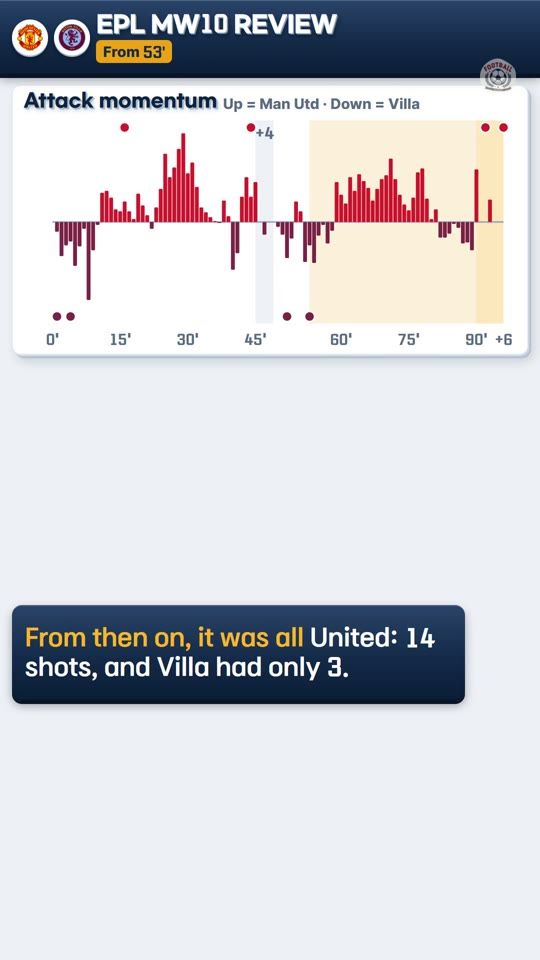 Short · 57sEPL review short, Man Utd 4-4 Aston VillaTwo goals in stoppage time aloneFootball Report · 2026-11-10
Every video has a manifest with data sources, composition, render version and upload URL. The list on this page was generated from those records.
Each image is a single frame cut from the video file with ffmpeg: the actual screen, not a thumbnail.
Each project carries an operating-rules document; hooks block paid calls and visible console windows before they run. Every incident becomes a rule.
From data collection to automated videos and reports, designed as a system one person can run.
Get in touch